Chart
Charts are far better for displaying data visually than tables and have the added benefit that no one is ever going to press-gang them into use as a layout tool. They’re easier to look at and convey data quickly, but they’re not always easy to create.

Setting up
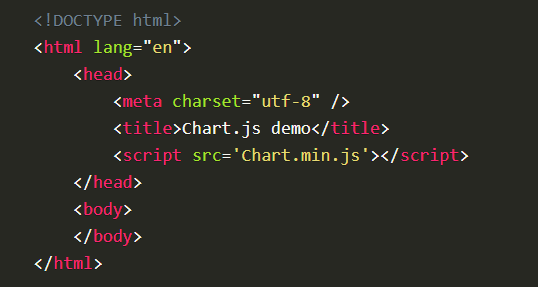
The first thing we need to do is download Chart.js. Copy the Chart.min.js out of the unzipped folder and into the directory you’ll be working in. Then create a new html page and import the script:
Drawing a line chart
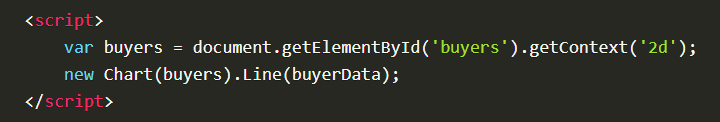
To draw a line chart, the first thing we need to do is create a canvas element in our HTML in which Chart.js can draw our chart. So add this to the body of our HTML page:

Next, we need to write a script that will retrieve the context of the canvas, so add this to the foot of your body element:
Creating a Chart

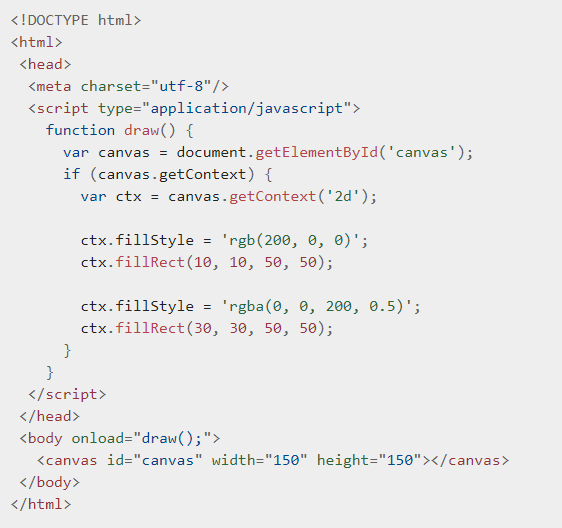
Required </ canvas> tag
As a consequence of the way fallback is provided, unlike the < img> element, the < canvas> element requires the closing tag ( < /canvas>). If this tag is not present, the rest of the document would be considered the fallback content and wouldn’t be displayed.
If fallback content is not needed, a simple < canvas id=”foo” …></ canvas> is fully compatible with all browsers that support canvas at all.
Example